Utilization Rate: The Number Every Agency Owner Should Track
What utilization rate is, how to calculate it, what good looks like, and what to do when it's dropping. The single most important metric for service businesses.
 Vipul A M · · 3 min read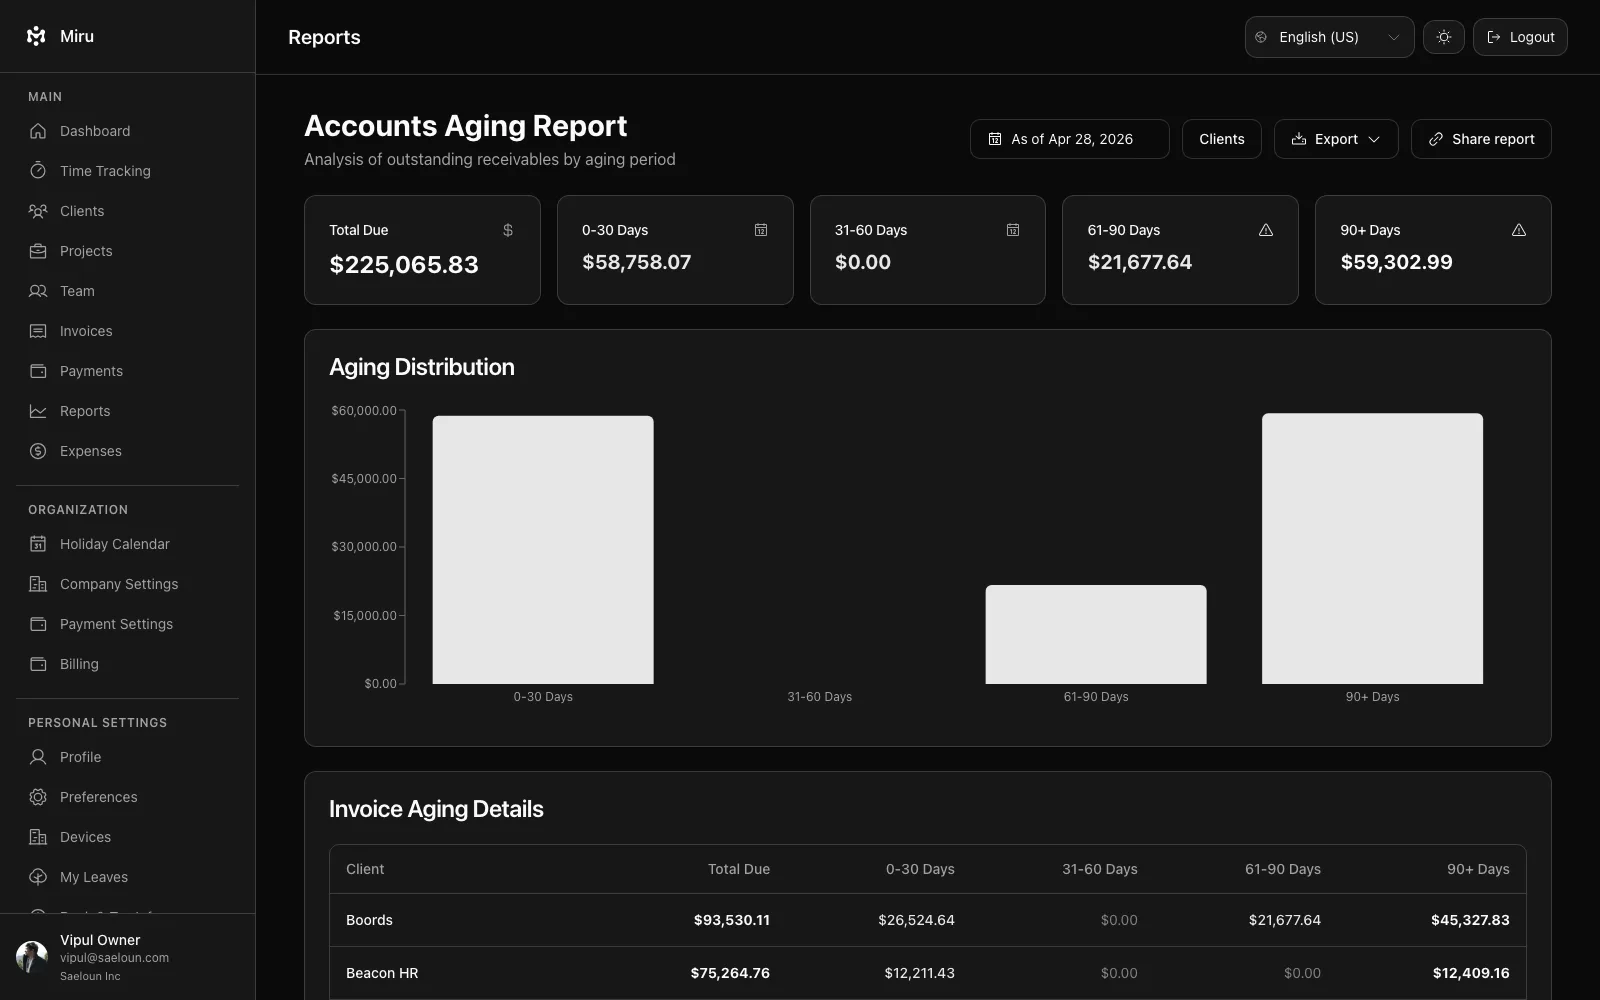
The formula
Utilization rate = billable hours / total available hours x 100
If your team has 1,000 available hours in a month and 700 of those are billable, your utilization rate is 70%.
Available hours means the hours your team is at work and capable of doing work. Exclude PTO, holidays, and sick days. Include everything else — meetings, admin, internal projects, and client work.
Billable hours means the hours you can (and do) invoice a client for. The ones that generate revenue.
The gap between those two numbers is your overhead. Internal meetings, sales calls, admin work, learning, context switching, and all the other things that are necessary but don’t produce invoices.
What good looks like
70-80% is the target range for most agencies. This means roughly three-quarters of your team’s time produces revenue. The remaining 20-30% covers internal operations, professional development, and the administrative overhead that keeps the business running.
Below 60% is a problem. Your team is spending more time on non-billable work than they should. Common causes: too many internal meetings, poor project scoping (lots of rework), a sales pipeline that’s not converting, or team members who aren’t fully loaded with client work.
Above 90% is also a problem. It means your team has no slack. No time for learning, no time for internal improvements, no time to think. This leads to burnout, turnover, and declining quality. A team running at 95% utilization is a team about to lose its best people.
The sweet spot is 75%. Enough billable work to be profitable. Enough overhead to invest in the team and the business.
How Miru shows it
Every time entry in Miru is tagged to a project, and every project is either billable or non-billable. The reports dashboard calculates utilization automatically.
Pull the team report for last month. The utilization column tells you the story. Per person, per project, and for the team as a whole.
miru reports summary --period last-monthThe CLI gives you the same data in your terminal. Run it Monday morning, share it in the team standup, and everyone knows where they stand.
What you’re looking for: trends. A single week at 60% isn’t alarming. Three consecutive months at 60% is a structural problem that needs fixing.
What to do when utilization is low
Low utilization almost always comes from one of four places:
Too many meetings. Audit your calendar. If your developers are in meetings 2+ hours a day, that’s 25% of their available time consumed before they write a line of code. Cut the meetings that don’t directly contribute to client deliverables.
Poor project scoping. If your team spends 20 hours on rework for every 40 hours of new work, your effective utilization is much lower than it looks. Better scoping documents, clearer requirements, and more upfront design work pay for themselves in reduced rework.
Unbalanced workload. One developer at 95% and another at 50% averages to 72%, which looks fine. It’s not. Redistribute the work so nobody is drowning and nobody is idle.
Not enough client work. If your pipeline isn’t producing enough billable projects, utilization drops no matter how efficient your team is. This is a sales problem, not an operations problem. Fix the top of the funnel.
Track it weekly, review it monthly
Don’t wait for the quarterly review to discover your utilization dropped to 55% in February. By then, you’ve lost a month of potential revenue and the team habits that caused it are entrenched.
Pull the report every Monday. Takes two minutes. If utilization is trending down, investigate immediately. If it’s stable in the 70-80% range, you’re doing fine.
The agencies that track utilization consistently are the agencies that stay profitable. The ones that don’t are the ones that wonder where the money went. Start tracking with Miru — it’s free for teams of five, and the reports are there from day one.
Hard Stop
Run this loop for two weeks without skipping cleanup. The compounding effect is real.
Start with Miru or read the docs.
Vipul A M
Co-founder at Saeloun. Building Miru. Rails contributor. Shipping from Pune, India.
Read next
Time Tracking Is Not Employee Monitoring
A researched guide to privacy-first time tracking for agencies: what to measure, what to avoid, and why billing accuracy beats screenshots.
How to Bill Clients Without Losing Your Mind
A practical guide to client billing for agencies: time tracking, invoicing, expense management, and getting paid on time.
Billing for Remote Teams: What We Learned Running a Distributed Agency
Practical lessons from billing clients across timezones. Time tracking, invoicing, and getting paid when your team spans continents.
Put it to work
Run one cleaner billing cycle in Miru.
If this article is about tracking time, billing clients, comparing tools, or automating work, Miru is the product version of that idea. Start for $1/member, invite the team, and send the next invoice from tracked work.
What you get
- Time tracking, invoices, expenses, and payments in one place.
- $1 per member per month. Free if you self-host.
- Open source, with CLI, API, MCP, and self-hosting paths.
The article is the argument. Miru is the workflow.
Track the work, approve the hours, send the invoice, and get paid without bolting together three separate tools.